
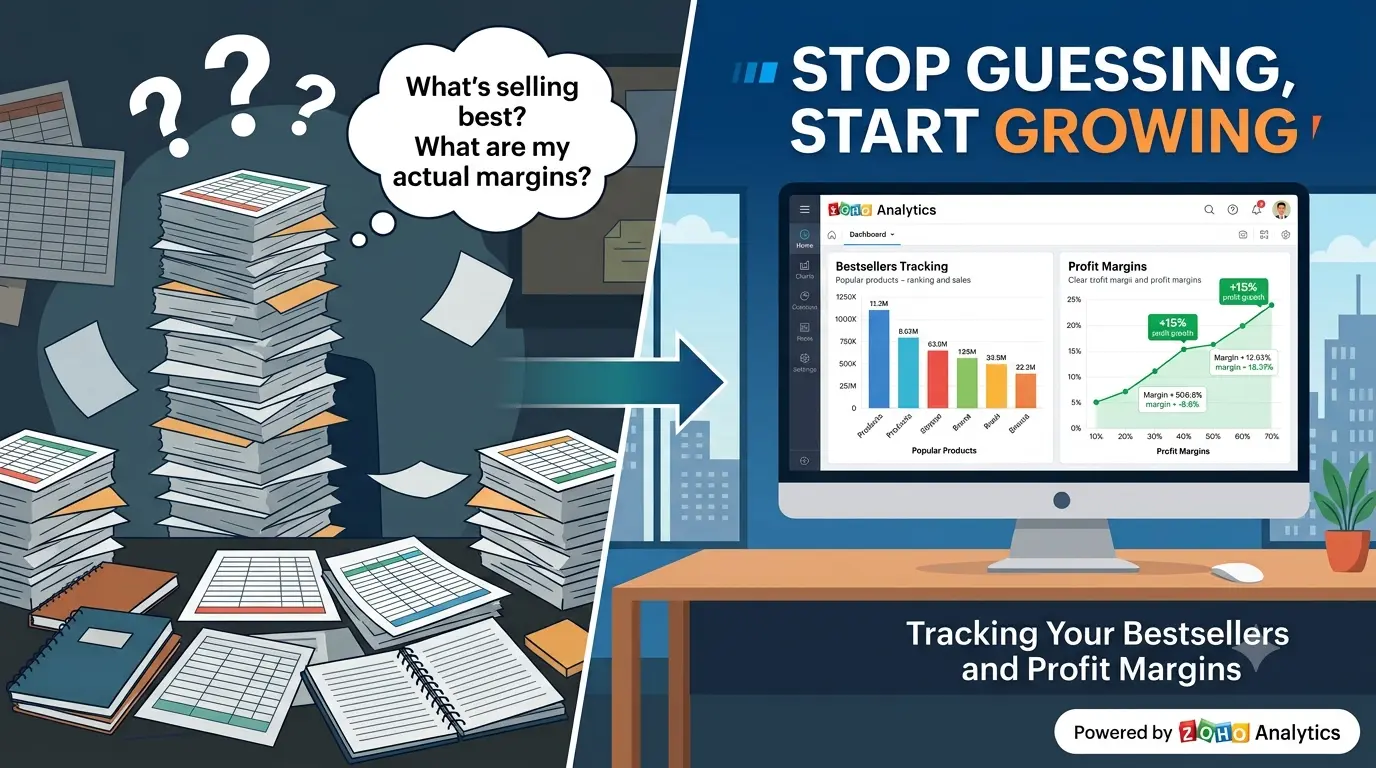
Every month, the same ritual. You open five spreadsheets, squint at your marketplace reports, add a few numbers on your phone calculator, and arrive at a figure that feels roughly right. Sales look decent. The bestseller is still the bestseller, probably. And profit? Well, there is money in the bank, so something must be working.
That is not tracking. That is guessing with extra steps.
Zoho Analytics is a self-service business intelligence tool that pulls your sales, inventory, and accounting data into one place, then turns it into live reports and dashboards. Instead of stitching spreadsheets together, you get answers on demand: which products actually sell, which ones actually earn, and which ones quietly drain your margins. For growing Indian businesses already using Zoho Books, Zoho Inventory, Zoho CRM, or platforms like Shopify and WooCommerce, it connects directly to the data you already have.
And that changes the questions you can ask.
Why your “bestseller” might be losing you money
Here is the uncomfortable part. Your highest-selling product and your most profitable product are often two different products. A unit that flies off the shelf at a thin 6% margin can generate less real profit than a slower item earning 38% — and if the fast mover comes with higher return rates, courier costs, or marketplace commissions, it may be costing you money on every order.
Most owners never see this. Not because the data does not exist — it does, scattered across invoices, purchase bills, and payment gateway statements — but because nobody has time to assemble it manually every week. So decisions default to gut feeling. More ad spend on the “winner.” Bigger purchase orders for the item everyone talks about. Meanwhile the genuinely profitable products sit under-stocked and under-promoted.
A proper profit margin report ends that blindness in one screen.
How does Zoho Analytics track your best-selling products?
Zoho Analytics imports order and item data from sources like Zoho Books, Zoho Inventory, Shopify, WooCommerce, or Amazon, then ranks products by units sold, revenue, and growth over any date range. Pre-built ecommerce dashboards show your most and least selling products automatically, so bestseller tracking becomes a live report instead of a monthly spreadsheet exercise.
Once the connection is set up, the tool refreshes data on a schedule you choose. You can slice bestsellers by category, region, sales channel, or season. Want to know which products dominated Diwali orders in Delhi versus Bangalore? Two clicks. Want to spot an item whose sales are sliding before it becomes dead stock? The trend chart shows it weeks earlier than your instinct will.
There is also Zia, the built-in AI assistant. Type a plain question — “top 10 products by revenue this quarter” — and it builds the report for you. No formulas. No pivot tables. Honestly, this one feature saves more hours than most owners expect.
Tracking real profit margins, not just revenue
Revenue is vanity, margin is sanity — old line, still true. To track profit margins properly, Zoho Analytics blends your sales data with cost data. Connect Zoho Books and it can calculate item-wise profitability: selling price minus purchase cost, minus the pieces most spreadsheets forget, like shipping charges, marketplace fees, and discounts.
The result is a margin view at every level that matters:
Per product, so you know exactly what each SKU earns after costs. Per category, so you can see whether accessories are subsidising your main line or the other way around. Per channel, because a 22% margin on your own website can shrink to 9% on a marketplace once commissions bite. And per customer segment, which often reveals that your “big” clients demand discounts that make them your least profitable relationships.
You can also set KPI widgets with thresholds. Margin on a product drops below your comfort line? The dashboard flags it in red before the quarter ends, not after.
What a growth dashboard actually looks like
One of our clients — a mid-sized trading business running Zoho Books — described their old reporting process as “archaeology.” Digging through last month’s numbers to explain what already went wrong. After moving to a Zoho Analytics dashboard, the owner opens a single screen every morning: yesterday’s sales, top five products by profit (not just volume), margin trend for the month, and pending orders by status.
“We stopped arguing about what we think is selling,” he told us. “The screen settles it in ten seconds.”
That is the real shift. Not prettier charts — faster, calmer decisions. Reorder quantities based on actual velocity. Ad budgets pointed at high-margin winners. Price corrections made in week two instead of month four. Over a year, those small corrections compound into serious money.
Do you need a data team to set this up?
No. Zoho Analytics is built for business users, with drag-and-drop report building and more than a hundred pre-built visualizations for ecommerce and finance data. Most small and mid-sized businesses can go from raw data to a working sales dashboard within days, especially with a certified Zoho partner handling the initial setup and data connections.
But — and this is worth saying plainly — the setup quality decides everything. Connect the wrong cost fields, skip the freight charges, misalign your GST treatment, and your “profit” report will confidently mislead you. A dashboard that lies is worse than no dashboard at all. This is exactly where experienced implementation matters: mapping your actual cost structure into the reports so the margins you see are the margins you earn.
Frequently Asked Questions
Is Zoho Analytics good for small businesses in India?
Yes. It is priced for SMBs, works in INR, integrates natively with Zoho Books and Zoho Inventory (both widely used by Indian businesses), and needs no technical team to operate day to day. Setup support from a local Zoho partner in India makes adoption even faster.
Can Zoho Analytics show profit per product?
It can. By combining sales data with purchase and cost data from Zoho Books or your inventory system, it calculates item-wise margins — including quantity sold, total sales, and margin percentage for every SKU over any period you choose.
Which platforms does it connect to?
Zoho apps (Books, Inventory, CRM, Billing), ecommerce platforms like Shopify, WooCommerce, Amazon, and BigCommerce, plus databases, Excel files, and Google Sheets. You can blend multiple sources in a single report.
How is this different from the built-in reports in Zoho Books?
Zoho Books reports are fixed-format and app-specific. Zoho Analytics lets you customise everything, combine data across apps and channels, build live dashboards, set alerts, and ask questions in plain English through Zia.
How long does implementation take?
For a typical SMB with Zoho Books or Shopify data, a working bestseller and profit margin dashboard usually takes under two weeks with a partner — often less. Complex multi-channel setups take longer, mostly for cost-mapping accuracy.
Ready to see your real numbers?
Guesswork got your business this far. Data will take it further. If you want your bestseller tracking and profit margin reports set up correctly the first time, TechMagify is a trusted Zoho partner in India, helping businesses implement Zoho Analytics, Zoho Books, Zoho CRM, and the full Zoho ecosystem. Their team handles data connections, custom dashboards, and cost-mapping so the margins on your screen match the money in your bank. Visit www.techmagify.com to book a free consultation — and stop guessing, start growing.